Your watch measures exactly one thing: how much light comes back out of your wrist. Everything else — heart rate, sleep, stress, recovery — is inference layered on top. Here is what that inference can carry, and where it breaks.
We have spent time summarising research literature on measuring stress and health in soldiers — around 165 papers, NATO technical reports and national defence studies. Much of what we found applies to anyone wearing a watch or a ring, and some of it contradicts what the devices tell their owners every morning.
The useful conclusions were not the ones we expected. The sensor is better than its reputation at some things almost nobody uses it for, and considerably worse at the things it is marketed on. And its errors are not random — they lean consistently in one direction, which is the part that should concern you most.
One sensor, one number, everything else inferred
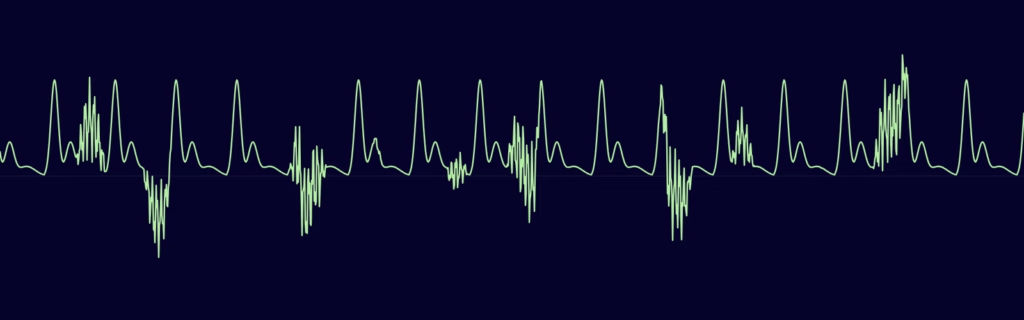
Turn your watch over. The green lights are LEDs, and beside them sits a photodiode. The LEDs shine into your skin; the photodiode counts the photons that scatter back. Blood absorbs green light well, so when your heart pushes a pulse of blood through the capillaries under the sensor, fewer photons return. Between beats, more do.
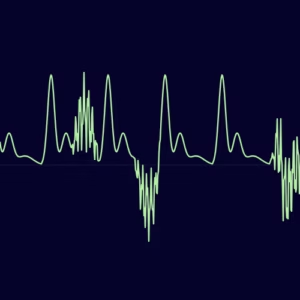
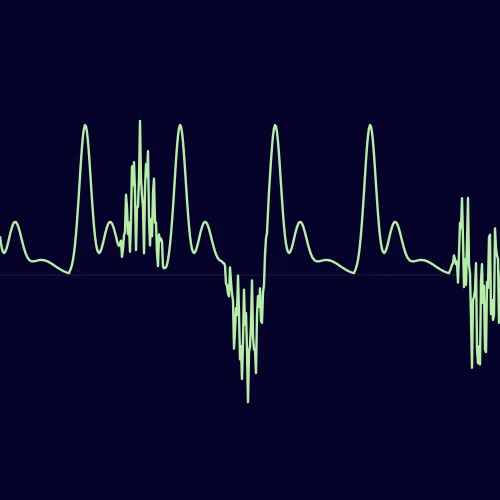
That rising and falling count, sampled many times a second, is the entire raw measurement. It is called photoplethysmography — PPG. It produces a waveform, and every other figure your device shows you is computed from it.
Heart rate is the interval between peaks. Heart rate variability is the variation in those intervals. Sleep staging is a model fed by heart rate, motion and temperature. Blood oxygen adds a second and third wavelength — red and infrared — and compares how they are absorbed. Respiratory rate is extracted from the way your breathing subtly modulates your pulse timing.
None of that is fake. But it does mean the whole edifice rests on one fragile physical fact: light has to get in and back out cleanly. Anything that disturbs that — the sensor shifting on your wrist, cold shutting down blood flow to your skin, a tattoo, a poor fit — degrades every number above it simultaneously.
Four numbers worth holding on to
- 6 days — how far in advance wearable data has predicted infection, before any test (Conroy et al., 2022)
- 3 bpm — a typical person’s whole week of resting heart rate variation (Quer et al., n=92,457)
- 29–52% — how often consumer trackers correctly identify that you are awake (Schyvens et al., 2025)
- −10.9 bpm — wrist optical heart rate error at high intensity; it under-reads (Knodel et al., 2025)
The strongest uses are the quietest ones
Start with the good news, because it is better than the sceptics allow. These are the things an optical sensor does well enough to act on.
Detect that you are getting ill, before you know it. Machine learning on continuous wearable data has identified infection up to six days before a diagnostic test, with an area under the curve of 0.82 — well into useful territory. Resting heart rate, respiratory rate and temperature all drift before symptoms arrive. This is arguably the single most valuable thing a wrist sensor does, and almost nobody buys one for it.
Track your resting heart rate over weeks. Boring, unglamorous, and the most reliable signal on the device. Measured at night, over time, against yourself, it moves with fitness, illness, alcohol, altitude, heat and accumulated fatigue. It is a genuine window into whether the last month has cost you something.
Measure how long and how regularly you sleep. Not the stages — the duration and the timing. Sensitivity for detecting sleep at all runs 92 to 96 per cent, which is good. Sleep regularity, meaning going to bed and waking at consistent times, turns out to predict health outcomes at least as well as duration does, and a watch measures it accurately.
Capture beat-to-beat variability at rest. The interval between successive heartbeats varies constantly, and the size of that variation reflects how much your parasympathetic nervous system — the “rest and recover” side — is in charge. Measured overnight, against your own baseline, this is a real physiological signal with real predictive content.
Warn about heat strain during exertion. Heart rate combined with modelling predicts exertional heat illness 33 to 69 minutes before onset. Military algorithms estimating core body temperature from sequential heart rate readings achieve a bias of −0.03 °C against an ingestible reference. This works.
Estimate respiratory rate while you are still. Your breathing modulates the timing of your heartbeats, so respiratory rate can be pulled out of the pulse signal without any additional sensor. At rest this is accurate; during movement it is not.
Notice the pattern. Everything on that list is measured at rest, over time, and against the person’s own history. That is the sensor’s home ground.
What your watch means when it says you are stressed
This is the feature people care about most and the one where the gap between marketing and evidence is widest. So let us be precise about what is established and what is not.
What is real
Acute psychological stress genuinely does suppress heart rate variability. A systematic review covering 60 studies of tactical and emergency personnel found consistent reductions under stressor exposure, and consistent recovery afterwards. Lower resting variability has been associated with poorer situational awareness and worse decision-making on marksmanship and navigation tasks. The underlying physiology is sound.
The metric that carries this is RMSSD — the root mean square of successive differences between heartbeats. It survives short recordings, it indexes vagal tone cleanly, and it moves in the expected direction. If your device reports RMSSD, it is reporting something meaningful.
Three things that break it
Physical effort drowns out psychological stress. This is the central problem, and it is quantified. In one study using a dynamic military scenario, heart rate corrected for movement predicted self-reported stress with an R² of just 0.11. The same signal, uncorrected, predicted mental effort at 0.42. In other words: the raw signal is mostly tracking how hard you are working. Subtract the movement, and very little stress signal remains. A person carrying a heavy pack in the heat has a heart rate that is almost entirely exertion and thermoregulation.
Getting fitter looks exactly like getting less stressed. Across twelve weeks of army basic training, recruits’ overnight RMSSD rose from 86 to 106 milliseconds. Not because the training got easier — because their aerobic fitness improved. Both fitness adaptation and stress recovery push the number the same way. Any programme running longer than about a month conflates the two unless it accounts for fitness explicitly.
A high reading is ambiguous. You would assume high variability means well recovered. Usually it does. But deep overreaching — the state past useful training stress — can produce an exaggerated parasympathetic increase that looks identical. Variability alone cannot distinguish “thriving” from “in trouble.”
There is no gold standard for stress. Subjective and physiological responses routinely dissociate — people report feeling fine while their physiology says otherwise, and the reverse. Which means every “stress detection accuracy” figure in the wearable literature is accuracy against an arbitrarily chosen reference.
And a subtler point worth carrying
In a 2024 study of repeated load carriage, participants’ cognitive performance was largely maintained. On the face of it, no effect. But their subjective mental effort rose from “almost no effort” to “considerable effort,” and their heart rate variability fell 31 to 41 per cent. They held their output steady by spending reserve.
A study measuring only performance would have reported nothing happening. The physiological data was the only thing that showed the cost. That is a genuine argument for measurement — and a warning that what a person can still do is not the same as what it is costing them.
Compare yourself to yourself, and nothing else
A study of 92,457 people wearing consumer devices established something that should change how you read every number your watch gives you.
Individual resting heart rate across that population ranged from 40 to 109 beats per minute. Sex, age, body mass index and sleep duration combined explained only about 10 per cent of that spread. Which is to say: knowing everything demographic about a person tells you almost nothing about what their normal looks like.
But within a single person, the median week-to-week fluctuation was 3 beats per minute, and roughly 80 per cent of people never varied by more than 10 in a week.
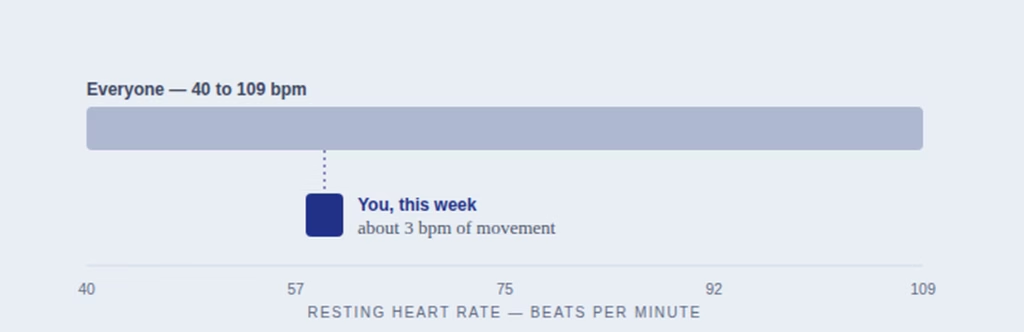
how much people differ from each other — and a substantial personal
event for almost anyone.
The consequence is direct. A resting heart rate of 62 tells you nothing on its own. A resting heart rate of 62 when you have run at 57 for the past month tells you something worth investigating. Population reference ranges carry almost no information; your own history carries nearly all of it.
This is why any serious monitoring programme spends one to two weeks establishing a personal baseline before it draws a single conclusion, and then compares each new reading against a rolling personal average rather than a published normal range.
What not to measure, and when not to believe it
Some of these are limits of the physics. Some are limits of the maths. One or two are marketing claims that the underlying sensor cannot support at all.
Blood glucose — the sensor cannot do this. No optical wrist or finger device can measure blood glucose non-invasively. The US Food and Drug Administration has issued a standing safety communication warning against smartwatches and rings claiming to. If a product claims it, that tells you something important about the product.
Sleep stages. Six consumer trackers assessed against clinical polysomnography showed sensitivity for sleep of 92 to 96 per cent — good — but specificity for wake of only 29 to 52 per cent. They call almost everything sleep. The consequence is systematic: they overestimate how long you slept and underestimate how long you lay awake. Use the duration, ignore the pie chart of stages.
Any “stress score” built on LF/HF ratio. The ratio of low-frequency to high-frequency power in the heart rate signal was long presented as a measure of the balance between the two branches of the autonomic nervous system. It is not, and this has been settled in the literature for over a decade. It remains the most common methodological error in the field, and it is embedded in a great many consumer stress features.
Heart rate during hard exercise. Wrist optical sensing under-reads, and the error grows with intensity — from about −4 bpm at low intensity to −10.9 bpm at high intensity, with data dropping out entirely under sweat and movement. For interval training or anything where the upper end matters, a chest strap is not a luxury.
Blood oxygen anywhere but at rest, warm and still. Under motion, wearable oxygen saturation missed between 12 and 92 per cent of readings depending on intensity. In the cold it is worse: at a finger temperature of 19 °C the median error against a reference device was 11 percentage points. And carbon monoxide — from a stove, a vehicle, a fire — makes a pulse oximeter read high, because it cannot distinguish carbon monoxide from oxygen on haemoglobin.
Absolute numbers from a single reading. One measurement, on one morning, against a population range, tells you close to nothing. The within-person variance is far smaller than the between-person variance, so a single value carries almost no information without your own history behind it.
Comparisons across devices, or across firmware versions. Apple reports variability as SDNN; Android’s Health Connect reports RMSSD. Different statistics. And the algorithms themselves change: Apple’s sleep staging has been revised three times since 2020, most recently improving wake detection from 70 to 79 per cent accuracy. Same wrist, same person, different numbers after an update you did not choose and were not told about.
Proprietary readiness and recovery scores, as evidence. The inputs may be individually validated. The weighting function that turns them into a single number is undisclosed and changes silently. Treat these as a nudge, not a measurement.
There is one more limitation that deserves naming plainly, because it affects some people more than others. Pulse oximetry has a documented skin pigmentation bias: dangerously low blood oxygen hidden behind a normal-looking reading occurs roughly three times more often in patients with darker skin. Worse, the error is amplified by poor circulation — so cold hands and darker skin compound rather than simply adding. Regulators are revising the test requirements, but as of 2025 only one of 34 devices assessed passed the anticipated new criteria.
The errors all lean the same way
Take the two best-documented failure modes together. Optical heart rate under-reads at high intensity. Sleep trackers over-call sleep. Both errors make the wearer look better than they are — better rested, working less hard.
If the errors were random, they would average out across a week and you could largely ignore them. They are not random. They are directional, and they point toward false reassurance. And they grow precisely under the conditions where accurate information matters most: during hard effort, in the cold, when someone is sleep-deprived and moving.
For a consumer optimising a training week, that is a mild annoyance. For anyone using these devices to make a decision about whether a person is fit to continue — an athlete, a shift worker, a soldier, a patient — it is the failure mode that matters, and it is the one least likely to be caught, because a reassuring number does not prompt anyone to check.
A device that fails toward “you are fine” is more dangerous than one that fails randomly, because nobody investigates good news.
Seven rules for reading your own data
- Compare yourself to yourself. Give it one to two weeks before you draw any conclusion, then judge every reading against your own rolling average rather than a published normal range.
- Trust the trend, not the reading. A single morning’s number is noise. A fortnight’s direction is signal.
- Measure at night, at rest. Overnight measurement removes posture, activity, caffeine, cognition and the question of whether you remembered. It is the cleanest window the sensor gets.
- Use RMSSD, and ignore anything built on LF/HF. If your app lets you see the underlying metric, look at it. If it only shows a proprietary score, hold it loosely.
- Know what moves your baseline that is not stress. Fitness, alcohol, illness, altitude, heat, dehydration, a late meal, and simply breathing more slowly than usual all shift these numbers. Fitness in particular drifts your baseline over months.
- Discard anything measured while you were moving. Motion is the dominant error source for every optical metric. If the reading was taken during activity and it matters, get it another way.
- When a number surprises you, ask whether the software changed. Algorithm revisions arrive silently with operating system updates and can shift your apparent baseline overnight.
What to trust, and how far
| Measurement | Verdict | Conditions |
|---|---|---|
| Resting heart rate trend | Trust it | Overnight, against your own baseline, over weeks |
| Sleep duration & regularity | Trust it | Duration and timing only — not the stage breakdown |
| Illness onset | Trust it | Multi-signal drift from baseline; genuinely early |
| Heart rate at rest or light activity | Trust it | Good fit, still or steady movement |
| Overnight heart rate variability | With care | RMSSD only, personal baseline, account for fitness drift |
| Respiratory rate | With care | At rest only |
| Blood oxygen | With care | Trend only, at rest, warm. Not in cold or near combustion |
| Heart rate at high intensity | Don’t rely on it | Under-reads by up to 11 bpm; use a chest strap |
| Sleep stages | Don’t rely on it | Wake detection is close to a coin flip |
| Stress scores from LF/HF | Don’t rely on it | The metric does not measure what it claims |
| Blood glucose | Not possible | No optical wearable can do this |
None of this makes wearables useless. It makes them instruments with a known operating envelope — which is the ordinary condition of every instrument ever built. The mistake is not using them. The mistake is reading them outside the range where they work.
Where this came from
Nerio Defense builds sweTAK for Android and iOS, where an important part is concerning the picture of the health of the soldier. We want to create a physiological monitoring and readiness capability for armed forces. Before starting building, we reviewed the evidence base on soldier stress and its measurement — roughly 165 peer-reviewed papers, NATO Science and Technology Organization reports, and national defence research studies, with the null and negative findings reported alongside the positive ones.
The full briefing covers the stressors that act on a dismounted soldier, what can honestly be measured in the field, the landmark research including the Nordic and Swedish contributions, and which resilience interventions survive a controlled trial. It runs to about thirty pages and includes a plain-language glossary of every abbreviation.
A note on the sources. Every figure in this article comes from peer-reviewed literature or an official regulatory or defence publication. Where a finding was contested, or where we could not verify a number against a primary source, we have said so in the full briefing rather than quietly rounding it off.
A note on what this is not. Nothing here is medical advice. If a number from your watch worries you, the right response is a clinician, not a forum or this article.